Cross-industry
The Complete Guide to Caregiver Call-Off Costs
Learn how to model the financial impact of caregiver call-offs, calculate lost billable hours, and recover margin in your home care agency.
Pixelum
September 23, 2026
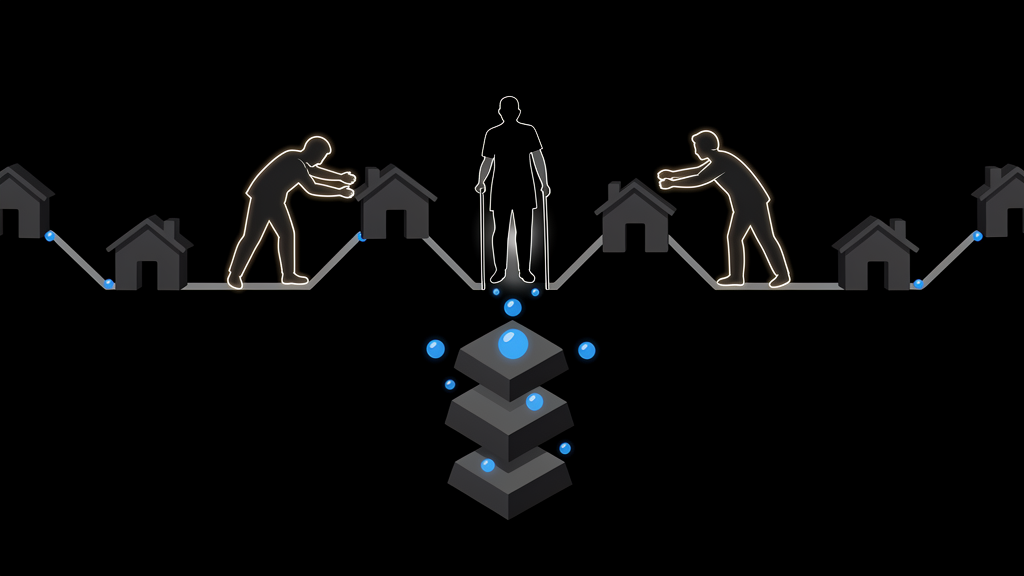
Do you know what a single caregiver call-off costs your agency? Not the scramble, not the frustration. The actual number. Most home care operators can tell you call-offs happen. Fewer can tell you what they cost per incident, per week, or per year. That gap between "I know it's a problem" and "I know exactly how much it's costing me" is where margin quietly disappears.
This guide walks you through building a financial impact model for caregiver call-offs. You'll learn what to measure, how to calculate the real cost, and where to focus your recovery effort. If you've been running on gut feel about call-off costs, what follows is a way to replace that feeling with numbers.
Key Takeaways: The Complete Guide to Caregiver Call-Off Costs
- A single caregiver call-off carries hidden costs in office time, overtime premiums, and unbilled hours that add up fast.
- Building a financial impact model starts with tracking three measurable categories: coordination cost, coverage premium, and lost revenue.
- Schedule inconsistency and call-off frequency are connected, and 2025 research confirms the link to higher absenteeism rates.
- Pixelum helps home care operators quantify lost billable hours and map the gap between authorized care and revenue collected.
- Recovering even a fraction of lost caregiver hours can shift annual margin by tens of thousands of dollars.
What Is a Caregiver Call-Off and Why Does It Cost More Than You Think?
A caregiver call-off happens when a scheduled caregiver doesn't show up for a shift, for any reason: illness, transportation, childcare, burnout. The visible cost is the missed visit. The invisible cost is everything your office does to respond.
When a call-off hits, someone on your team (usually the scheduler) spends 30 to 60 minutes making calls to find a replacement. If the replacement is already near overtime, you pay a premium. If no replacement is found, those authorized hours go unbilled entirely.
None of that appears as a line item on your P&L. It shows up as a scheduler who can't get to other work, a payroll number that's slightly higher than expected, and a client who received zero hours of care that day.
The Three Cost Categories in Every Caregiver Call-Off
Every call-off generates cost in three places. Separating them is the first step toward building a model you can defend.
Coordination Cost: The Office Time You're Already Paying For
Your scheduler is salaried or hourly. When they spend 40 minutes calling around to cover a shift, that's 40 minutes of paid office time diverted from intake, billing follow-up, or care coordination. No invoice is generated. No report flags the cost. It's absorbed into a line that reads the same on a quiet Tuesday and a bad one.
To measure it: divide your loaded office hourly rate by 60, then multiply by the minutes spent covering each call-off. Track this for one week. The number is usually the part that surprises people.
Coverage Premium: What You Pay to Fill the Gap
If the replacement caregiver is already at or near overtime, the premium is real money. Even if the replacement is a regular-hour caregiver who wasn't originally scheduled, the redeployment may leave another client's visit uncovered downstream.
Measure it by capturing the difference between the replacement caregiver's rate and the original caregiver's rate, multiplied by hours covered. If overtime is involved, the math is straightforward: the overtime differential times hours worked.
Lost Revenue: Hours That Were Authorized but Never Billed
This is typically the largest number. When a call-off results in no replacement, those authorized hours go unbilled. Your agency had permission to bill for that time. The caregiver didn't show. The revenue evaporated.
Calculate it by taking hours never covered multiplied by the difference between the bill rate and the caregiver rate. In many agencies, identifying 10 to 20 percent of authorized hours that never convert to billed revenue is common. That's margin sitting on the table.
How to Build a Financial Impact Model for Caregiver Call-Offs
A financial impact model for call-offs doesn't need to be complicated. It needs to be honest. Here's a step-by-step approach you can run in a single week.
Step 1: Track Every Call-Off for One Week
Pick one week. Every time a shift falls through, note three things: how many minutes of office time it consumed (from the first phone call to the confirmed replacement or the confirmed gap), who covered the shift, and how many hours went unfilled. Don't change anything about your process yet. Just observe.
Step 2: Calculate the Per-Incident Cost
Use this formula for each call-off:
Per call-off cost = coordination cost + coverage premium + unfilled revenue
Where:
- Coordination cost = (minutes to cover / 60) x loaded office hourly rate
- Coverage premium = extra hourly cost of replacement x hours covered
- Unfilled revenue = hours never covered x (bill rate minus caregiver rate)
Run that calculation for every call-off in your tracking week. Sum the totals.
Step 3: Annualize the Number
Multiply your weekly total by 52. The result is a directional annual cost that most operators have never seen before. It's not a precise forecast, but it gives you something more useful than a gut feeling: a range you can test and refine.
For a 50-caregiver agency averaging 8 call-offs per week, even a modest per-incident cost of $150 produces an annual figure north of $62,000. Agencies with higher bill rates or longer shift durations will see that number climb quickly.
Step 4: Segment by Cause
Not all call-offs are the same. Some are illness. Some are transportation. Some are burnout. Group your call-offs by cause during your tracking week and calculate the cost per category. The category with the highest dollar impact is where your fix should start.
Step 5: Rank Recovery Opportunities by Return
Once you've identified the highest-cost cause, estimate what it would cost to reduce call-offs in that category by 25 percent. Compare the fix cost to the recovered revenue. If the return is positive, you've found your first constraint worth addressing.
This is the same logic Pixelum applies in every engagement: rank the fixes by what they return, not by what's easiest. A pattern we see repeatedly in home care is that the highest-return fix isn't the one operators expect.
What Does Research Say About Caregiver Absenteeism Costs?
The Bureau of Labor Statistics has found that the average absenteeism rate across all industries sits just under 3 percent. For caregivers in home care, that number is closer to 10 percent. According to Activated Insights, some studies suggest unplanned absenteeism costs may exceed 15 percent of all agency profits.
A 2025 study published in the Journal of Operations Management examined 1.2 million home care visits and found that schedule inconsistency increased caregiver absenteeism by roughly 19 percent when moving from the 25th to the 75th percentile of schedule variability. The same study showed that schedule discontinuity (unpaid gaps between visits during a single workday) raised absenteeism by 20 percent.
The practical implication: scheduling patterns and call-off frequency are connected. If your agency runs fragmented or inconsistent caregiver schedules, your call-off volume is likely higher than it needs to be, and the cost model you build will reflect that.
How Schedule Inconsistency Drives Higher Call-Off Rates
Most agencies treat call-offs as a people problem. The evidence points to a system problem. When caregivers face week-to-week schedule variability, where Monday's hours look different from last Monday's, they can't establish personal routines. Childcare arrangements break down. Second jobs conflict. Burnout accelerates.
The result is more call-offs. Not because the caregiver is unreliable, but because the schedule is. Pixelum's Operations Intelligence Report for home care agencies quantifies this pattern by measuring the gap between authorized hours and hours that convert to billed revenue, surfacing where coordination drag suppresses margin.
If your model shows a high call-off rate, the next question isn't "who keeps calling off?" It's "what does the schedule look like for the people who call off most?"
The Hidden Costs That Don't Appear on Your P&L
Beyond coordination cost, coverage premium, and lost revenue, call-offs generate costs that are real but harder to quantify.
Client Relationship Damage
When a client expects a caregiver and nobody shows, trust erodes. Repeated call-offs lead to client attrition. In home care, where referral relationships are the primary growth engine, a lost client is more expensive than the missed visit alone.
Staff Morale and Cascading Burnout
Caregivers who consistently cover for absent colleagues carry an unfair coordination load. Over time, they burn out and become the next wave of call-offs. This cascading effect is one reason absenteeism rates in home care exceed industry averages by a wide margin.
Compliance and Safety Risk
Sending an unfamiliar caregiver to a client with complex needs introduces risk. The replacement may not know the care plan, the medication schedule, or the client's specific requirements. Errors in these situations carry both regulatory and human cost.
How to Quantify Caregiver Time Recovery Value
Time recovery is the flip side of the call-off cost model. Instead of asking "what do call-offs cost me?" you ask "what would I gain if I recovered a portion of those lost hours?"
Calculate Your Billable Hour Gap
Take total authorized hours for a month. Subtract total billed hours. The difference is your billable hour gap. In many agencies, this gap runs between 10 and 20 percent of authorized hours. That's not a staffing problem. It's a coordination problem: the hours existed, the authorization existed, but the caregiver didn't show or the schedule broke down.
Assign a Dollar Value to the Gap
Multiply the gap hours by your average margin per billable hour (bill rate minus caregiver cost). The result is the revenue your agency had permission to earn but didn't. That's not a hypothetical. Those hours were authorized. The capacity existed. The revenue was available.
Model Partial Recovery Scenarios
Full recovery is unrealistic. Some call-offs will always happen. Model what happens if you recover 10, 25, or 50 percent of lost hours. Even a 10 percent recovery on a significant gap can shift annual margin by tens of thousands of dollars, depending on your agency size and bill rates.
Pixelum's Revenue Loss Quantification Analysis is built for exactly this kind of modeling, identifying where authorized hours leak and what recovering them is worth in dollar terms.
What Operators Who Manage Call-Off Costs Differently Do
Agencies that keep call-off costs low don't do it by being lucky. They do it by measuring something that most agencies ignore.
They Track Call-Off Cost Per Incident, Not Just Frequency
Knowing you had 12 call-offs last week tells you something. Knowing those 12 call-offs cost $4,200 tells you whether it's worth fixing. Frequency without financial context is noise.
They Separate Coordination Drag from Caregiver Reliability
The scheduler spending 45 minutes per call-off is a coordination cost, not a caregiver reliability metric. Agencies that see the distinction invest in scheduling systems that reduce the coordination load per incident instead of only punishing the caregiver who called off.
They Model Before They Buy
Before investing in new scheduling software or staffing changes, these operators build a financial model that quantifies the constraint. They know the annual cost. They know which cause drives the largest share. They invest where the return is highest, not where the fix is easiest.
Common Mistakes When Modeling Caregiver Call-Off Financial Impact
Building a financial impact model is straightforward. Getting it wrong is common. Here are the mistakes that undermine the exercise.
Ignoring the Office Time Component
The most frequent error is leaving out the coordination cost. Because the scheduler is already on payroll, the time spent covering call-offs doesn't feel like an expense. But it is. It's time pulled from intake, billing, and care coordination. Over a year, it may add up to a full-time equivalent of administrative capacity.
Counting Only Unfilled Shifts, Not Partially Filled Ones
A shift that was supposed to be four hours but gets covered for two still has a two-hour revenue gap. Partial coverage is not full recovery. Your model should capture partial fills as well.
Treating All Call-Offs as Equal
A Monday morning call-off on a high-margin private-pay client costs more than a Friday afternoon call-off on a lower-margin Medicaid visit. Your model should weight call-offs by the margin of the affected visit, not just count them.
Adding a "Relationship Cost" You Can't Defend
Client relationship damage is real. But inventing a number for it undermines the three costs you can calculate. Keep the model clean. If someone asks about relationship cost, describe the pattern qualitatively and let the measurable numbers carry the financial argument.
How Pixelum Helps Home Care Agencies Model and Recover Call-Off Costs
Pixelum works with home care agencies to build the financial picture most operators have never seen. The Profit Map, Pixelum's fixed-fee diagnostic, examines your agency's operating and financial data to identify where margin leaks. Call-off cost is one of the patterns that surfaces consistently.
The Operations Intelligence Report for home care agencies quantifies billable hours lost to call-offs and administrative overhead, showing the dollar value of recovering that lost time. It's not a guess. It's your data, mapped to specific constraints, with the recovery math attached.
If your agency runs 50 or more caregivers and you've never modeled the financial impact of call-offs, a Profit Map gives you that picture in about three weeks. The plan is yours to keep, whatever you decide next. Get your Profit Map. Prefer to talk first? Book 15 minutes.
FAQs About Caregiver Call-Off Costs
What is the average cost of a single caregiver call-off?
The cost varies by agency size, bill rate, and how long it takes to find coverage. A typical call-off includes 30 to 60 minutes of office coordination time, a potential overtime premium, and any unbilled hours. Agencies that track all three categories consistently find the per-incident cost is higher than expected.
How do you calculate lost revenue from caregiver call-offs?
Take the hours that were authorized but never billed, then multiply by the margin per hour (bill rate minus caregiver cost). This gives you the revenue your agency had permission to collect but lost due to the call-off. Pixelum's Revenue Loss Quantification Analysis helps agencies identify and measure this gap precisely.
Why do caregiver call-off rates run higher than other industries?
Caregiver absenteeism rates hover near 10 percent compared to 3 percent for the general workforce. The combination of physically demanding work, inconsistent schedules, low wages relative to workload, and high emotional intensity contributes to higher call-off frequency in home care.
Can scheduling changes reduce caregiver call-offs?
Yes. Research published in 2025 found that reducing schedule inconsistency lowered caregiver absenteeism by up to 9.5 percent. Pixelum's approach starts with diagnosing the scheduling patterns that correlate with high call-off rates and then building the coordination fix, whether that's a process change, a scheduling system, or both.
How does Pixelum help home care agencies recover lost caregiver hours?
Pixelum quantifies the gap between authorized and billed hours using your agency's own operating data. The Profit Map identifies the constraints driving call-off costs, ranks recovery opportunities by return, and delivers a plan with the financial math attached. Each step pays for itself before the next begins.
Related reading

Cross-industry
Why You Can't Hire or Buy The Solution your Home Care Business Needs
Software can't enforce. Consultants can't build. Dev shops can't diagnose. One hire can't be four people. What's left?
August 26, 2026

Cross-industry
7 Home Care Bottlenecks Scheduling Automation Solves
Discover 7 home care scheduling bottlenecks that drain margin through call-offs, manual matching, and poor routing, plus how automation closes each gap.
August 19, 2026

Cross-industry
7 Metrics That Reveal Lost Billable Hours in Home Care
Track these 7 metrics to catch billing leakage early and recover lost billable hours in home care operations before revenue loss compounds.
August 18, 2026
See where this shows up in your business
A three-week, fixed-fee diagnostic that finds exactly where margin leaks in your business — proven with your numbers, not our opinions.
Get your Profit Map